Automate Action in your Physical Operation
Our Vision AI + Your Cameras improves your operation’s throughput and revenue In Real Time







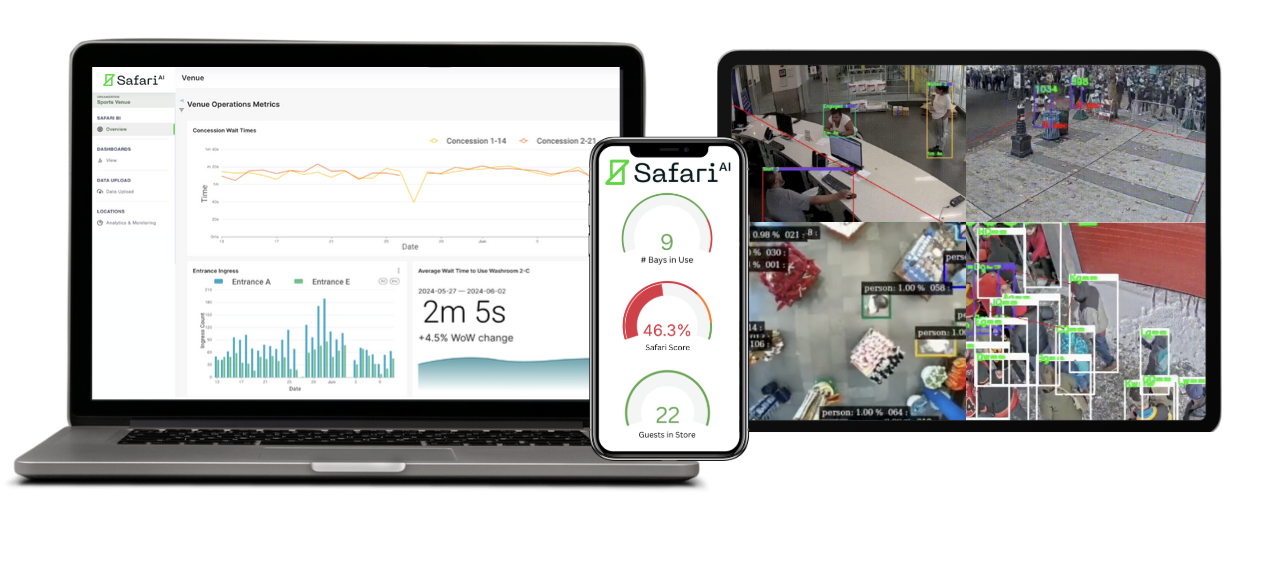
Smarter Operations, Powered by Vision AI
Turn your existing cameras into a 24/7 insights engine, get real‑time notifications, and deliver AI‑powered recommendations to staff and guests.
Measure
Auto‑measure & generate insights on your most critical operations 24/7/365 with 95%+ accuracy using your own cameras.
Alert
Set up real‑time alerts to yourself, teammates and even guests via email, text, robocalls, your app, Microsoft BI or API — anywhere else.
Recommend
Generate AI‑enabled recommendations to your staff and guests using your company’s written SOP as a foundation.
SOC 2 Certified
Safari AI is SOC 2-certified and audited every year to ensure that client and company data meet the highest international standards of privacy and cybersecurity.
Proven Results That Speak for Themselves

Real-Time Data & Alerts
via Dashboard or API
- Fully Customizable
- Real-Time Alerts Benchmarked to Performance
- Embedded Ground Truth QA Tool
- Unlimited Internal & External User Licenses
- Export Reports to XLS, CSV & More
Partnered with Industry Leaders
We collaborate with leading technology companies to deliver next-level operational performance through intelligent computer vision analytics.
Learn more



Industries We Serve

Theme Parks and Cultural Attractions
Theme Parks & Cultural Attractions use Safari AI to optimize guest flow and increase revenue through data-driven operational management.
Learn more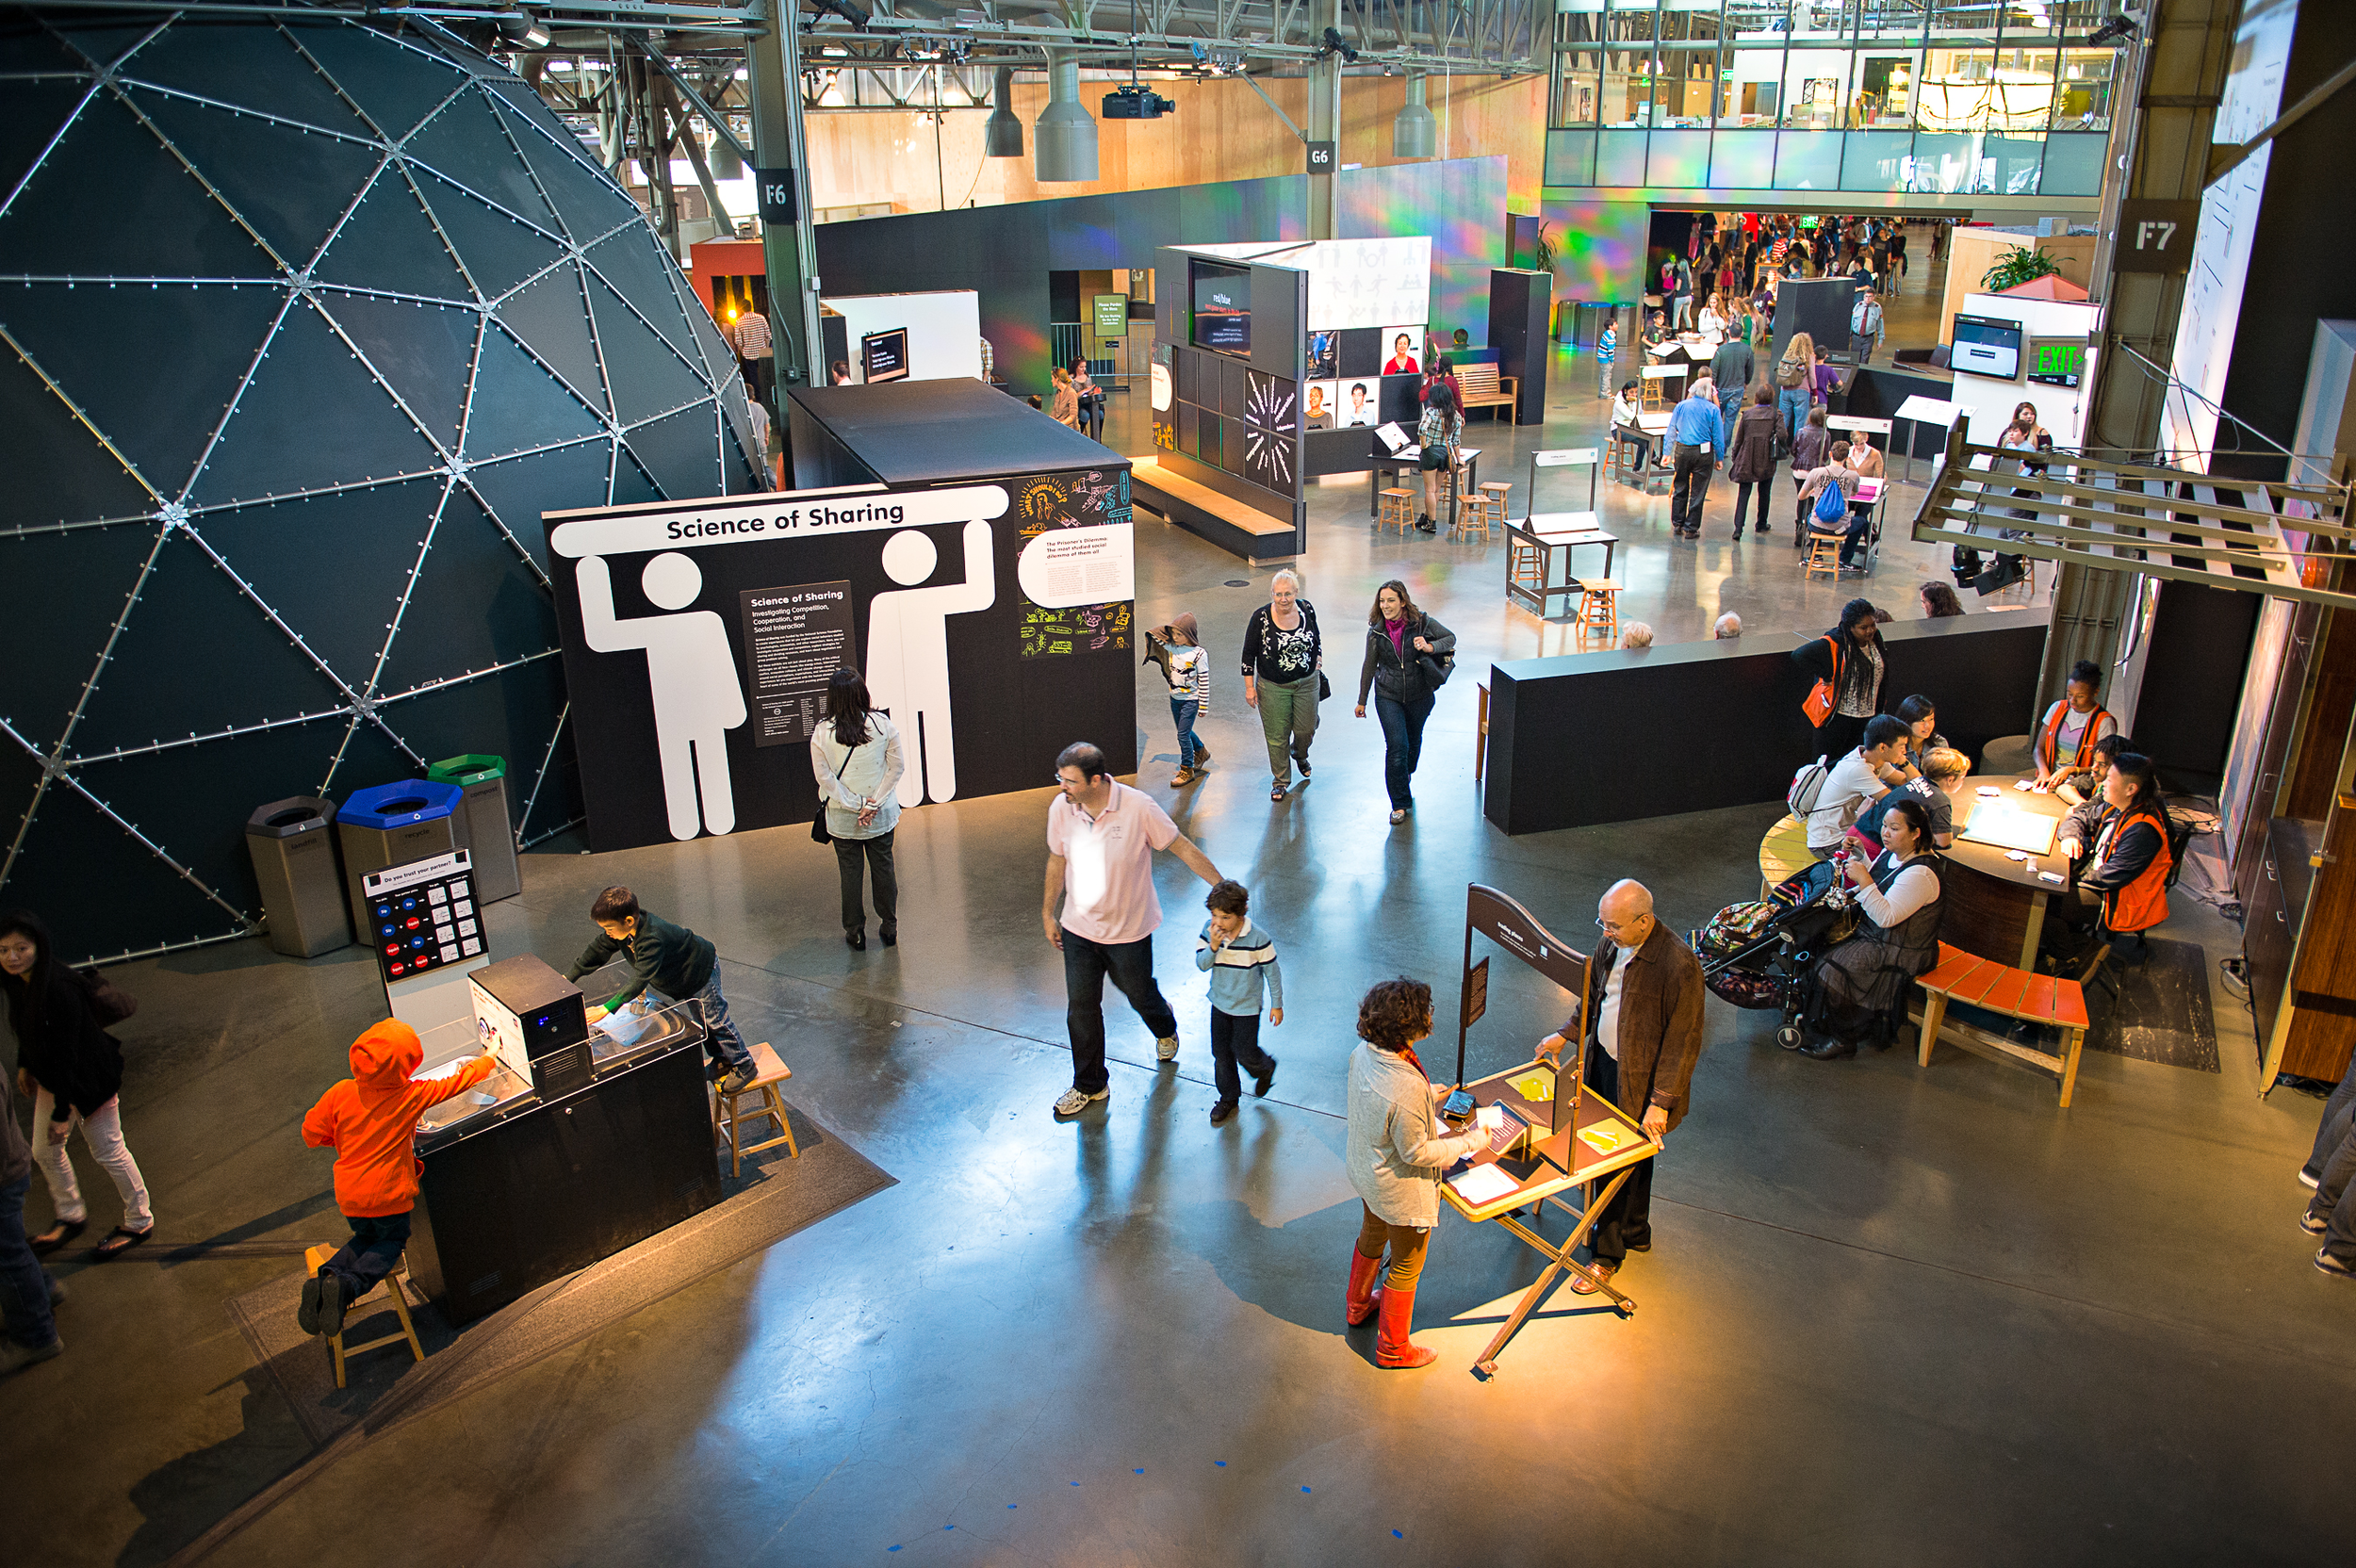
Museums, Aquariums, and Zoos
Safari AI helps leading museums, aquariums, and zoos optimize visitor experiences and increase revenue through real-time operational insights and data-driven capacity management.
Learn more
Ski Resorts
Ski Resorts use Safari AI to expand resort capacity by improving lift fill rates, measuring chair dispatches, and driving guest throughput.
Learn more
Stadiums, Arenas and Venues
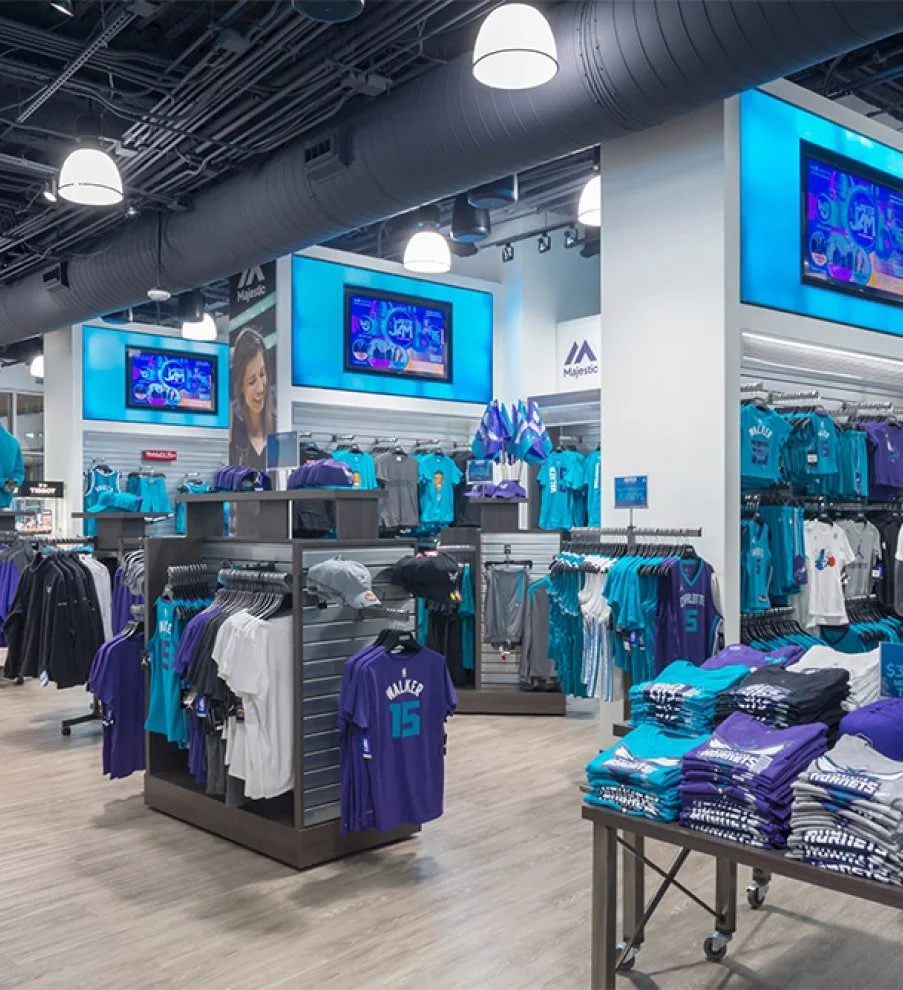
Live Venues use Safari AI to improve the Speed of Service throughout the Guest Journey at parking, entrances, concessions and retail.
Learn more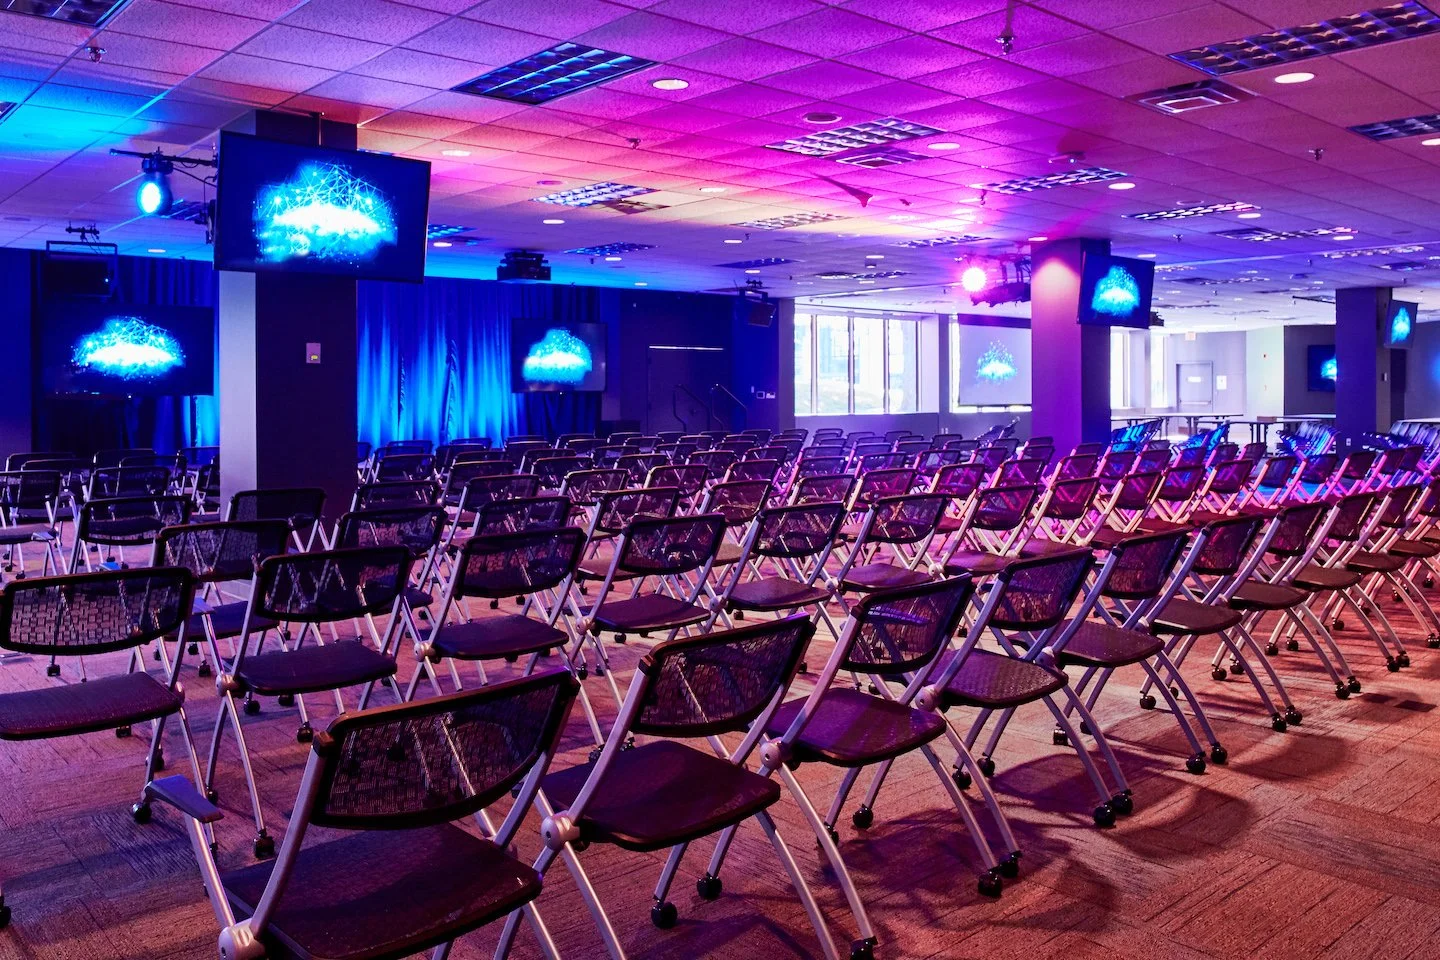
Conferences and Convention Centers
Conference & Convention Centers use Safari AI to drive revenue by understanding where, how and when visitors are using their space.
Learn more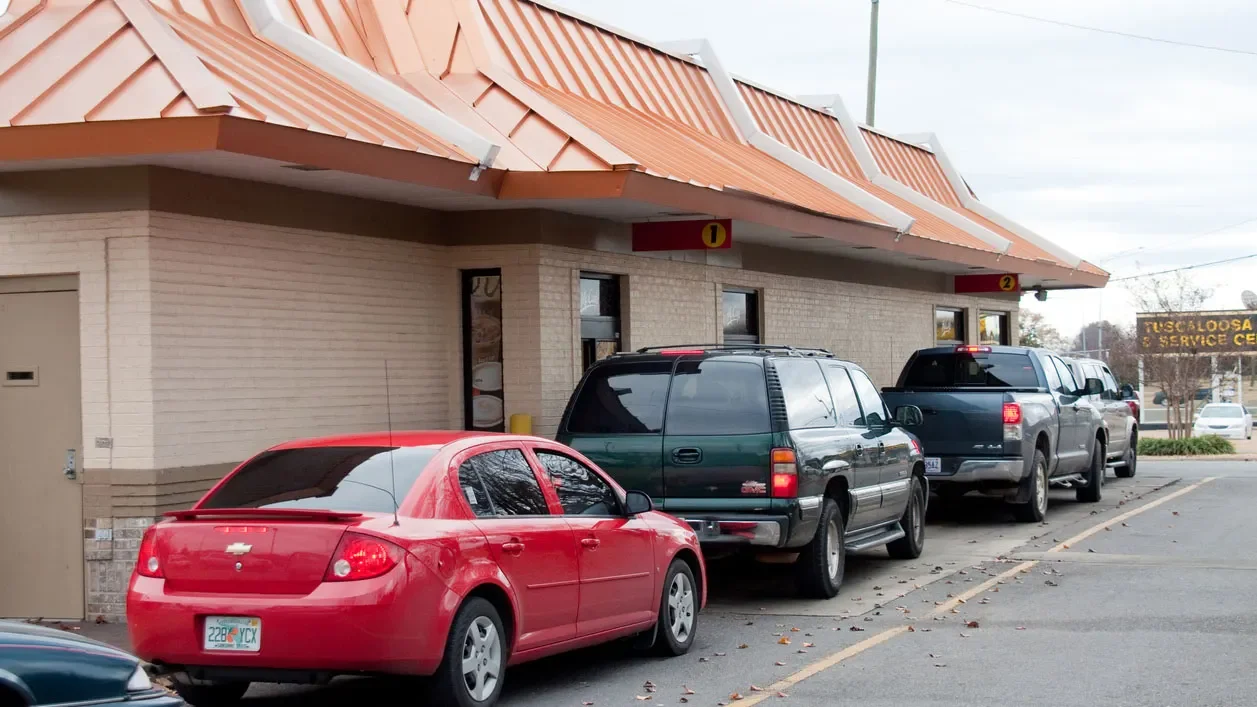
QSR’s and Drive-Thrus
QSR’s & Drive-Thrus use Safari AI to increase revenue by improving throughput in real-time.
Learn more
Retail and Shopping Malls
Retail clients use Safari AI to better understand and operationalize their physical funnel before the POS.
Learn more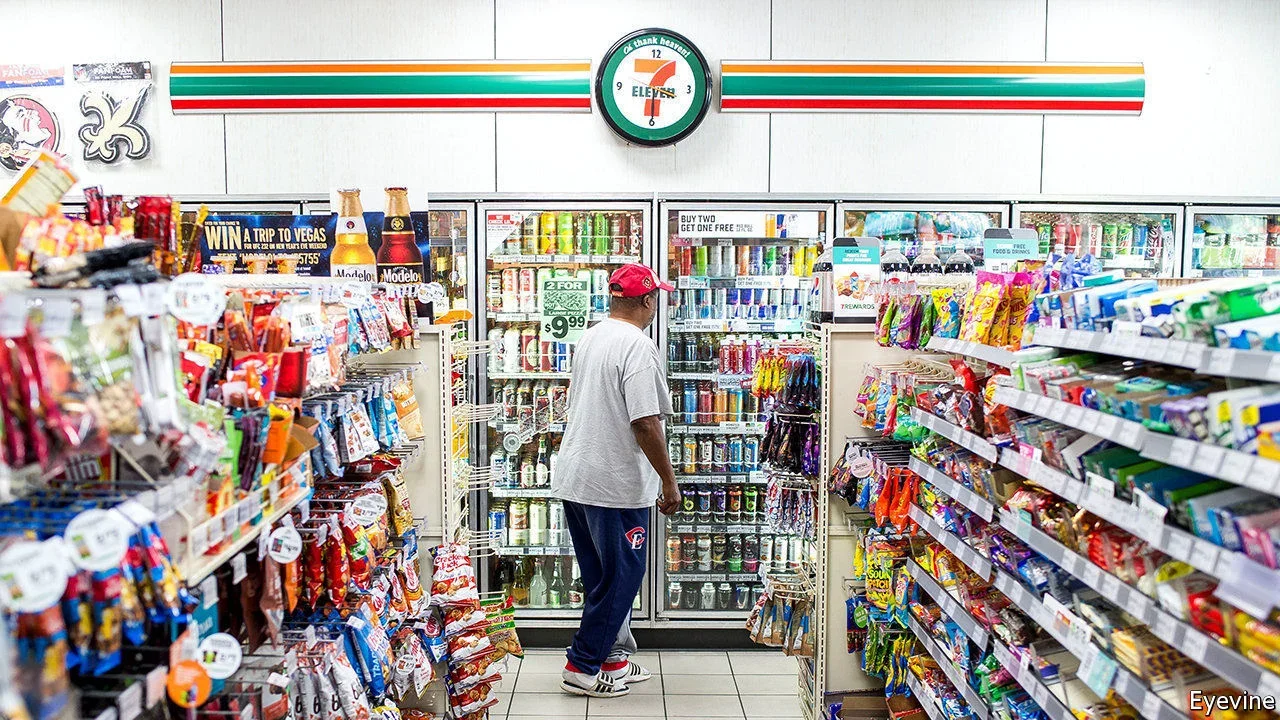
Gas Stations and Convenience Stores
Gas Stations & Convenience Stores use Safari AI to drive revenue by improving throughput and speed of service.
Learn more
Commercial Real Estate
CRE Owners & Managers use Safari AI to understand tenant usage and get ahead of leasing milestones.
Learn more
Parking, Garages, and Loading Dock Management
Parking and Facility Operators use Safari AI to drive revenue by optimizing capacity and pricing in real time.
Learn more
Shipping, Trucking, Logistics & Infrastructure
The Logistics industry uses Safari AI to identify bottlenecks and drive throughput at its assets.
Learn more
Government and BIDs
Government Agencies and BIDs use Safari AI to measure and better inform the utilization of their assets.
Learn more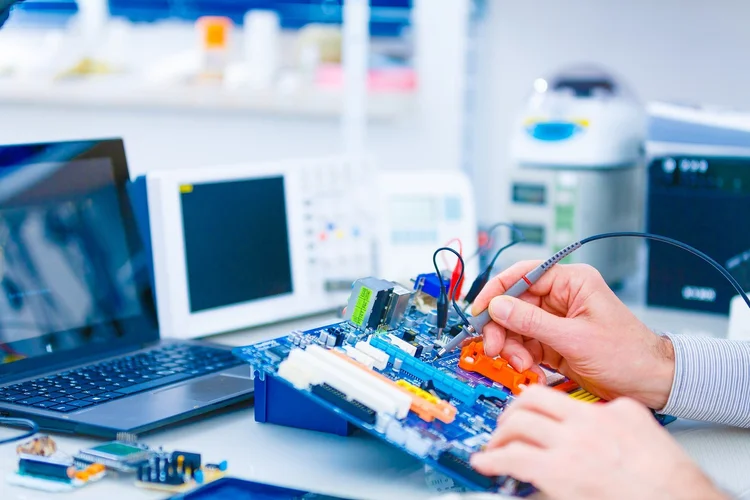
IT and Electronic Services
IT & Electronic Services manufacturers use Safari AI to monitor worker engagement and optimize production line performance.
Learn more
